Lauren F. V. Scharff,
Albert J.
Ahumada, Jr.*, Alyson L. Hill
Stephen F. Austin State University, Box 13046, Nacogdoches, TX 75962
*NASA Ames Research Center, Moffett Field, CA 94035-1000
Presented at the 1999 IS&T; / SPIE Electronic Imaging Symposium, January 24-29, San Jose, CA.
Published in B. E. Rogowitz and T. N. Pappas, eds., Human Vision and Electronic Imaging I , SPIE Proc. Vol. 3644, paper 27,1999.
A subsequent paper which examines predictability of readability usingspatial-frequency-filtered textures has since been published in Optics Express.
ABSTRACT
Several discriminability measures were correlated with reading speed over a range of screen backgrounds. Reading speed was measured using a search task in which observers tried to find one of three words in a short paragraph of black text. There were four background patterns (one plain, three periodic) combined with three colors (gray, blue, yellow) at two intensities. The text contrast had asmall positive correlation with speed (r = .43). Background RMS contrast showed a stronger, negative correlation (r = -.78). Text energy in the spatial frequency bands corresponding to lines and letters also showed strong relationships (r = -.80 and r = -.80, respectively). A general procedure for constructing a masking index from an image discrimination model is described and used to generate two example indices: a global masking index, based on a single filter model combining text contrast and background RMS contrast, and a spatial-frequency-selective masking index. These indices did not lead to better correlations than those of the RMS measures alone (r = .79 and .78, respectively), but they should lead to better correlations when there are larger variations in text contrast and masking patterns.
1. INTRODUCTION
The increased use of computer-presented text displays has increased the interest in predicting their readability. Readers may leave displays which are not easy to read, and poor readability can slow processing. While most displays have text presented on plain backgrounds, an increasing number use textured backgrounds,especially on the Internet. In addition to background texture, several other factors have been shown to influence the readability oftext displays, e.g., contrast, polarity, foreground and background colors, font style, line spacing, and text and margin widths.1 Although such information is useful, it does not necessarily allow a designer to predict how a new combination of such variables will influence the readability of his display. Also, text display designers may not be able to assess readability subjectively when making their design choices; correlations between subjective preference ratings and readability measures are consistently near zero.2-42. AN EXPERIMENT MEASURING READABILITY
The experiment used a 4 (texture) x 3 (color) x 2 (saturation/lightness) design. Full details of the methods and results are reported in Hill and Scharff1. The twenty-four conditions were each repeated six times, leading to a total of 144 actual trials.
2.1 Apparatus and Stimuli
Macintosh Power PC 7200/120 computers were used to create and run the experiment. The text portions of the stimuli were created in B/C Power Laboratory (an experiment application), which was also used to present the stimuli and collect the data. The color and saturation of the textured backgrounds were set in Adobe Photoshop. Viewing distance was controlled by a chin rest.
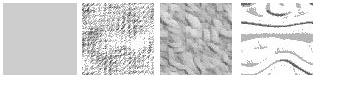
(a) Plain (b) Fine (c) Medium (d) Coarse
Figure 1 (a-d) Textured backgrounds used in current experiment.
Black text was placed on top of the textured backgrounds. Other variables were set to maximize readability: 2, 3 12 point (6 pixels per letter) Times New Roman font, and the text blocks (10.2 cm x 12.7cm ) were centered at the top of the screen, leaving a 2.5 cm margin on either side.2.2 Procedure
Fifty-two participants completed the experiment. The data from thirty-four low-error-rate participants were included in the analyses. All participants except two, the experimenters, were naive to the hypothesis. All participants had self-reported 20/20 or corrected to 20/20 vision.2.3 Results
The data were sorted by each condition for each participant and the median for each was calculated. The data from participants with an overall accuracy rate of at least 95% were used in the analyses, and of those, only reaction times from correct responses were used.
Figure 2. Three-way interaction, from Hill and Scharff1
These main effects were modified by interactions. The color x saturation interaction (F(2,66) = 3.50, p < .05) showed that light blue backgrounds were read significantly more slowly than all others except dark blue, and dark blue backgrounds were read significantly more slowly than the light gray and light yellow ones.3. PREDICTING READABILITY
As mentioned above, two approaches were used to predict readability of the different stimuli combinations: image measure regressions and indices generated from image discrimination models.
3.1 Image Measure Regressions
The specific image measures used included text contrast, background RMS contrast, and background RMS contrast in four spatial frequency bands that roughly segregate contrast energy corresponding to lines, short and long words, and letters. The text contrast was defined as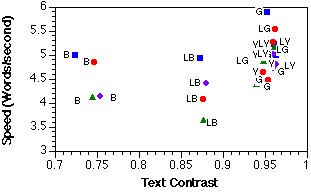
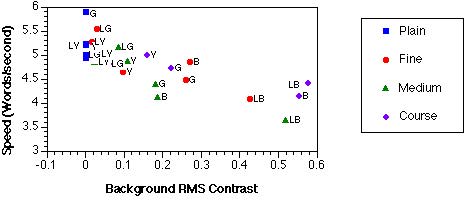
Figure 3. Scatter plots of the relationships between reading speed and text contrast (top) and background RMS contrast (bottom).
Average latencies were converted to reading speed estimates in words per sec by dividing the latency in seconds into 50, half the number of words per display. Figure 3 shows reading speed with respect to text contrast and background RMS contrast. The text contrast had a small positive correlation with speed (r = .43); background RMS contrast showed a stronger, negative correlation (r =-.78). Notice that dark blue backgrounds have the lowest text contrasts, but that the three light blue, textured backgrounds have large background contrast variations. This finding provides an explanation for the slow search times for the light blue backgrounds. Text energy in the spatial frequency bands corresponding to lines (0.1875-0.375 cpl) and letters (1.5-3 cpl) also showed strongrelationships (r = -.80 and r = -.80, respectively), although they were not significantly better than the spatial frequency bands corresponding to short (0.75-1.5 cpl) and long words (0.375-0.75 cpl) (r = -.72 and r = -.66, respectively).
3.2 Metrics based on Image Discriminability Models
Image discriminability models have been developed to predict the visibility of the difference between two similar images. They take two images as input, and output a prediction of the number of Just Noticeable Differences (JNDs) between them. The first computational model for two-dimensional images was developed by Watson10. A major application of these models has been as image quality metrics, an application in which the two images are often an original image and a reconstructed version following image compression, and the model predicts the visibility of the compression artifacts. Here we propose an adaptation of these models to predict readability of text on different backgrounds by regarding the text as an "artifact" whose visibility is masked by the background. We assume that in general, the easier it is to detect the text on the background, the easier it will be to read it.TC = (TL - LB)/LB,
BC = (BL - LB)/LB.
Next, each contrast image is converted into a list of visual features using linear transformations,
TV = V(TC),
BV = V(BC).
For example in Watson10 each element of the feature list is the cross-correlation of the contrast image with a Gabor weighting function having a particular position, spatial frequency, orientation, and phase. Then visual features masked by the background are computed using a masking function which has two inputs, the first being the masked features and the second the masking features,
TM = M(TV,BV),
BM = M(BV,BV).
Finally, the differences between the two masked-visual-featurelists are computed and aggregated using a Minkowski distance metric
d = DM (TM -BM),
where
DM (X) = (S|xi|b )1/b.
The sum is over the elements xi of the list X, and b is referred to as the Minkowski summation exponent.
In linearizable models, the masking function M is linear in the list of features being masked (TM -BM = M(TV -BV, BV)), the visual features are linear (TV - BV =V(TC - BC)), and the contrast calculation is linear (TC -BC = (TL - BL)/LB), so
d = DM (M(V((TL -BL)/ LB, BV)).
This equation says that for these models, one can define a target luminance image as the difference between the two images and that the visibility can be computed as the Minkowski length of the visual representation of the target masked by the background.
In our application BL will be the background image and TL will be the background with the text. If we let T be the text indicator image having the value 0 where there is no text and 1 where the there are text pixels, we see that
TL = T LT + (1 - T)BL,
where LT is the luminance of the black text.
TL - BL = (1-T )BL + T LT - BL= -T (BL - LT).
This equation says that the difference image is zero outside the text, and inside the text it is the difference between the text level and the background. The latter image can be regarded as having two parts
BL - LT = (BL -LB) + (LB - LT),
the difference of the background and its mean (change in texture) and the difference of the mean background and the text level (change in luminance). The first component can contribute to detectability (i.e. letters defined by texture can be detected13), but for computational simplicity we assume it does not significantly contribute to readability. Therefore, we remove it from the signal component, leaving
d = CT DM (M(V(-T,BV))),
where CT = (LB - LT)/LB is the contrast of the text based on the background mean luminance as before. This equation says that we can compute a detectability index for the text in a background by computing the detectability of full contrast text in that background and scaling it by the text contrast.
The detectability index depends strongly on the size of the text sample used. We form a readability index that has the dimensions of contrast by dividing this index by the Minkowski length of the unmasked, full contrast text. This equivalent masked contrast is the contrast for the unmasked text (masking V=0) that would give the same detectability. It is given by
d = CT DM (M(V(-T,BV))) / DM (M(V(-T,0))),
A final simplification we shall make in our readability indices based on image discrimination models is to assume a flat contrast sensitivity function. We assume that the reader is sitting close enough that the frequencies relevant to reading the text are in the optimal visual range (about 6 cpd) or lower.
3.3 A Global Masking Index
A single filter, image discrimination model with global RMS contrast masking generates an index combining text contrast and background RMS contrast. This model has been used to predict the detectability of targets in natural and noisy backgrounds.11,12, 14 The masking function in this model is the same for all the features, so it essentially assumes that the masking contrast energy is uniform over the target region and similar to the target in spatial frequency. The visual feature list for this model is the contrast image filtered by a contrast sensitivity filter. Since we are dropping that filter here, the visual feature list is the contrast image,
TV = TC,
BV = BC.
The text masking function for this model is
M(-T, BC) = -sT / (1+(CRMS / C2) 2) 0.5,
where CRMS is the background RMS contrast as above, C2 is the contrast masking threshold, whose value (0.05) was determined in the work referenced above, and s is a contrast sensitivity parameter.
For our binary text case, the discriminability index turns out to be
d = s nT 1/bCT / (1+(CRMS / C2) 2) 0.5.
where nT1/b is the Minkowski sum of the full-contrast text image. Our readability index eliminates the size of the text target and the contrast sensitivity, giving the effective luminance contrast CM of the masked text as
CM = CT/ (1+ (CRMS /C2) 2) 0.5 ,
The correlation for this index (r = .79) was not significantly stronger than that of CRMS alone (r = -.78), but the index should lead to better predictions when there are larger variations in text contrast.
3.4 A Frequency-Selective Masking Index
To predict the effect of background masking when the spatial frequency content of the background varies, a spatial-frequency-selective masking model can be used to compute the readability index CM. To test this concept on our data we used the Cortex Transform model used by Rohaly, Ahumada, andWatson.12 In this model the visual feature list V is formed by using the Cortex Transform. In our case this list had 20 images of simulated cortical units (5 octave spatial frequency bands and 4 orientation bands) and a high frequency and a low frequency residue. The transform was subsampled for spatial frequency but notf or orientation, giving a visual feature list 6.3 x 128 x 128 elements long (our 72 x 72 text and background images were padded with zeros to obtain an image size that was a power of two). The masking for this model is limited to within-feature masking. The masking function is given by
M(V(-T), BV) =-sV(T) / (1+ (|V| / C2) 2)0.5,
where | | indicates the list of the absolute values of the individual elements. In this case, to be consistent with the earlier work, we set C2 = 0. 07. The equivalent masked threshold contrast was then computed using a Minkowski summation exponent of b= 4.
The correlation for this index (r = .78) was essentially the same as for the global masking model index, but it should lead to better predictions when the background contrast variations vary in their spatial position and spatial frequency coincidence with the those of the text.
4. DISCUSSION
Each of the above approaches to predicting readability led to similar correlations with reading speed. Thus, if someone wanted to determine the cost-benefit of texture and contrast choices, we would currently recommend using the more simple, global masking index. The image measure regressions indicate that text contrast alone is a poor predictor of reading speed, and that RMS contrast energy in the background better predicts reading speed. However, the image-measures-regression approach does not allow trade-off calculations between the two measures. The results are similar to those of Rohaly, et al.,11, 12 in that the more complex index did not significantly increase the predictability.ACKNOWLEDGEMENTS
This work was supported in part by NASA RTOP 548-50-12.
REFERENCES
1. A. L. Hill and L. F. V. Scharff, "Readability of computer displays as a function of colour, saturation, and background texture," Proceedings for the Second International Conference for Engineering Psychology and Cognitive Ergonomics, (in press).
2. A. Hill and L. V. Scharff,"Readability of screen displays with various foreground/background color combinations, font styles, and font types," Proceedings of the Eleventh National Conference on Undergraduate Research, Vol. II, pp.742-746, 1997.
3. M. Youngman and L. V. Scharff,"Text width and border space influences on readability of GUIs,"Proceedings of the Twelfth National Conference on Undergraduate Research, Vol. II, pp. 786-789, 1998.
4. B. Parker and L. V. Scharff,"Influences of contrast sensitivity on text readability in the context of a GUI," http://hubel.sfasu.edu/research/agecontrast.html,1997.
5. D. H. Parish and G. Sperling, Object spatial frequencies, retinal spatial frequencies, noise, and the efficiency of letter discrimination. Vision Research 31, pp. 1399-1415, 1991.9. G. Schorno, "Texture tiles,"http://mars.ark.com/~gschorno/tiles/index.html, 1996.
10. A. B. Watson, "Detection and recognition of simple spatialforms," in O. J. Braddick and A. C. Sleigh, eds., Physical and Biological Processing of Images, pp. 100-114, Berlin:Springer-Verlag,1983.12. A.M. Rohaly, A. J. Ahumada, Jr., and A. B. Watson, "Object detection in natural backgrounds predicted by discrimination performance and models," Vision Research 37, pp. 3225-3235, 1997.
13. D. Regan and X. H. Hong, "Recognition and detection of texture-defined letters," Vision Research 34, pp. 2403-2407, 1994.
14. B.L. Beard and A. J. Ahumada, Jr., "Image discrimination models predict detection in fixed but not random noise," J. Opt. Soc. Amer. A 14, pp. 2471-2476, 1997.
15. A.J. Ahumada, Jr. and B. L. Beard, "A simple vision model for inhomogeneous image quality assessment," J. Morreale, ed., SID Digest 29 (Society for Information Display: Santa Ana, CA) Paper 40.1, 1998.
16. A. B. Watson, "DCTune: A technique for visual optimization of DCT quantization matrices for individual images," J. Morreale, ed., SID Digest 24 (Society for Information Display: Santa Ana, CA) pp. 946-949, 1993.