Letter identification performance is better for negativecontrast than positive contrast
Lauren F. V. Scharff, Stephen F. Austin State University,Nacogdoches, TX
http://hubel.sfasu.edu/scharff.html
Albert J. Ahumada, NASA Ames Research Center, Moffett Field,CA
http://vision.arc.nasa.gov/personnel/al/ahumada.html
Introduction
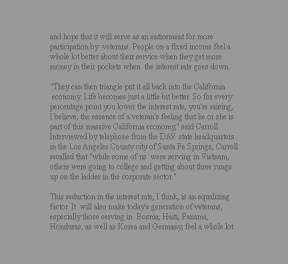
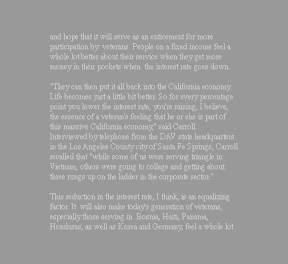
We have been trying to develop an equivalent contrast metric forpredicting the effects of textured backgrounds on text readability(Scharff, Ahumada, and Hill, 1999; Scharff, Hill, and Ahumada, 2000;Scharff and Ahumada, 2002; Scharff and Ahumada, 2003a). In the courseof trying to assess the usefulness of the metric for transparent texton textured backgrounds, Scharff and Ahumada (2002) measured textreadability for positive and negative contrast text on a plainbackground at two contrast levels, 30% and 45%. The observer‚stask was to find a target word (triangle, circle, or square) in atext paragraph as illustrated in Figure 1.
Figure 1. 45% contrast texts from Scharff and Ahumada (2002),negative (left) and positive (right).
Scharff and Ahumada (2003a) measured the identifiability of theindividual letters cut out from those target words. Both studiesfound better performance for negative contrast stimuli as shown inFigure 2. Scharff and Ahumada (2002) used a measure of contrast thatincluded the text in the background luminance calculation and thusdid predict a slightly higher contrast for the negative polaritytext. Scharff and Ahumada (2003a) found that the readability indexfit significantly better if a polarity factor was included in theindex and their single letter results are not sensibly explained byadaptation differences. Here we report additional measurements of thepolarity effect at lower contrasts than used by Scharff and Ahumada(2003a) on a more carefully calibrated display. These results werepresented to the Vision Sciences Society (Scharff and Ahumada,2003b). They indicated that at contrasts of 20% and 40%, positivecontrast letters are only as identifiable as negative contrastletters with 70 to 75% as much contrast.
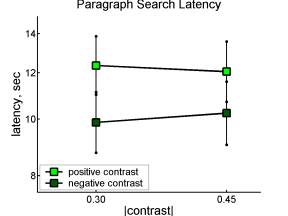
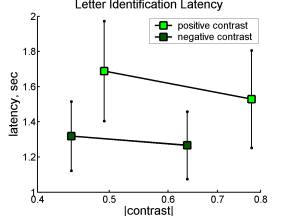
Figure 2: Response latencies vs. contrast for the paragraph wordsearch task data (left) of Scharff and Ahumada, (2002) and the letteridentification task data (right) of Scharff and Ahumada (2003a).Error bars indicate 95% confidence intervals based on observervariance in each condition.
Hypotheses
Some possible reasons for the improved performance for negativecontrast text include the following:
Separate gain hypothesis. The positive contrast system haslower gain than the negative contrast system (result opposite thatreported by Chan and Tyler (1992)). Beginning with the retinal level,the positive and negative contrast systems have different anatomicalstructures (Kolb, Fernandez, and Nelson, 2001), thus there is noreason to expect them to have the same gain. Contrast discriminationdata has been modeled by assuming that the positive and negativecontrast discrimination functions have the same form, but differentgains (Whittle, 1986, 1992; Kingdom and Moulden, 1991; Belaïdand Martens, 1998). To fit the discrimination data fordifferent background luminances, the relative gains needed to bereversed.
Fechnerian brightness hypothesis. Internal measures ofcontrast are computed from a „brightness‰ measure that isnegatively accelerating with respect to luminance.
Dark screen matrix hypothesis. Pixels on the screen aremade of a small number (~1) of dot triads on a dark matrix. The darkmatrix and the blue dots form low luminance boundary regions that areassimilated to the negative contrast regions. This can only occurwhen the contrast regions are above threshold locally.
Display nonlinearity hypothesis. Single light pixelsfollowing a background pixel are more like the background than aredark pixels because video amplifiers have a slower rise time thanfall time. This caused the old VT100 text with dim vertical strokesand bright horizontal strokes.
Under the separate gain hypothesis, but not the others, thepolarity effect should persist at low contrasts, so we measured theeffect at lower contrasts.
Methods
Figure 3. The twelve letter images atˆ40% contrast.
Observers were asked to identify the Scharff and Ahumada (2003)twelve lower case letters (acegilnqrstu) on a uniform background(Figure 3). At their narrowest, the vertical strokes were one pixelwide. A letter remained onscreen until the participant typed aresponse. Within each block of 36 trials, each letter was presentedat 3 contrast levels: 10%, 20%, and 40%. Six observers ran the 5negative contrast blocks first; seven observers ran the 5 positivecontrast blocks first.
The letters were displayed on a NEC Accusync CRT monitor with a0.28 mm dot trio pitch at a display resolution of approximately 0.26mm per pixel (effectively one pixel per dot trio). The viewingdistance was about 47 cm (forehead rest).
To test display linearity, we constructed six images,photometrically measured their average luminance, and computed theircontrast with respect to the background luminance. Two were verticalline images. Image (2:1) pixel columns alternated between thebackground level (0% contrast) and the +40% contrast level; in image(4:1) +40% pixel columns sandwiched 3 background pixels; and image(1:1) contained only +40% pixels. We also constructed the ˆ40%counterpart images. The resulting contrasts, shown below, do notreveal any appreciable nonlinearity.
+contrast
-contrast
Results
As Figure 4 shows, both performance measures, latency andaccuracy, were better for the negative contrast conditions at 20% and40% contrast, but were not different at 10% contrast, even though theaccuracy performance was better than chance.
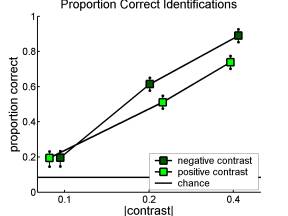
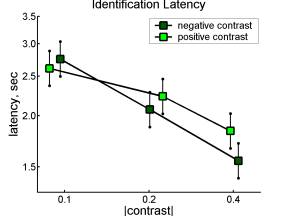
Figure 4: Letter identification accuracy plotted against theabsolute value of letter contrast (left). Letter identificationlatency plotted against the absolute value of contrast (right). Errorbars are 95% confidence intervals based on the observer by treatmentinteraction, except for the lower bars on the 0.1 contrast points inthe accuracy figure (left) that are based on the pooled observervariance for those points to allow comparison with chanceperformance.
For the 20% and 40% conditions, we used linear interpolation (inlog contrast) to find the contrast of the other polarity with theequivalent accuracy (left graph). This opposite polarity contrast andthe original contrast were used to determine the ratio of theeffectiveness of positive contrast to that of negative contrast:
The mean of the four estimates is 0.726 ± 0.036 (95%confidence interval).
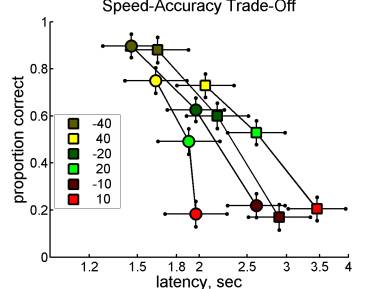
Figure 5: Letter identification accuracy vs. latency(speed-accuracy trade-off). Square symbols indicate conditions run infirst group of 5 blocks. Circles indicate second group of 5 blocks.Colors indicate the contrast in per cent. Error bars are 95%confidence intervals based on the observer x treatmentinteraction.
The speed accuracy trade-off graph (Figure 5) shows that whilecombined speed-accuracy performance was better in the second set of 5blocks (circles), the observers did not improve in accuracy; theyshortened their latencies instead. In the first blocks (squares), theobservers given the more difficult positive contrast task (lightsquares) took more time to be more accurate, but when this task wassecond (light circles), observers gave it even less time than wasgiven by the other observers doing the easier task second (darkcircles).
Conclusions
The contrast gain asymmetry for letter asymmetry persisted atcontrasts of 20% and 40%, but was not measurable at 10%, weaklyfailing to support the separate gain hypothesis.
The screen calibration results do not support the displaynonlinearity hypothesis. We would like more direct measures ofluminance modulation depth.
We are collecting data at twice the pixels per letter, but thesame letter size in visual angle, since the Fechnerian brightnesshypothesis predicts no effect of this manipulation, while the darkscreen matrix hypothesis predicts a strong drop in the effect.
The speed-accuracy trade-off effects were strong, so we plan toredo the contrast ratios using a combined accuracy-latencymeasure.
As signal detection theory taught us that false alarms arenecessary to measure detectability, speed-accuracy trade-off theoryshould remind us that errors are necessary to estimate performance inthe presence of possible trade-off effects.
Acknowledgements
The Airspace Operations Systems (AOS) Project of NASA's AirspaceSystems Program provided funding. NASA Ames Research Centercooperative agreement NCC 2-1095 with the San Jose State UniversityFoundation provided support. We are grateful for the assistance ofRyan Smith, Robin Rustad and Lori Shird.
References
Belaïd, N., and Martens, J.B. (1998). Grey scale, theŒcrispening effect', and perceptual linearization, SignalProcessing 70(3),231-245.
Chan, H., and Tyler, C.W. (1992). Increment and decrementasymmetries: Implications for pattern detection and appearance,Society for Information Display Digest 43, 251-254.
Kingdom, F., and Moulden, B. (1991). A model for contrastdiscrimination with incremental and decremental test patches, VisionResearch 31, 851-858.
Kolb, H., Fernandez, E., and Nelson, R. (2001). Webvision: Theorganization of the retina and visual system, Part II, Chapt. 2, Theouter plexiform layer. http://webvision.med.utah.edu/index.html,accessed April 30, 2003.
Scharff, L. F. V., and Ahumada, A. J. Jr. (2002). Predicting thereadability of transparent text, Journal of Vision 2(9),653-666.http://www.journalofvision.org/2/9/7/.
Scharff, L. F. V., and Ahumada, A. J. (2003a). Contrast measuresfor predicting text readability, B. E. Rogowitz and T. N. Pappas,eds., Human Vision and Electronic Imaging VII, SPIE Proc.5007, Paper 46.
Scharff, L. F. V., and Ahumada, A. J. Jr. (2003b). Letteridentification latencies are predicted by an asymmetric contrastmetric, Vision Sciences Society Abstracts, abstract TU752, p.223.
Scharff, L. F. V., Ahumada, A. J. Jr., Hill, A. L. (1999).Discriminability measures for predicting readability, in Human Visionand Electronic Imaging III, ed. B.E. Rogowitz and T.N. Pappas, Proc.Vol. 3644, pp. 270-277, SPIE, San Jose, CA.
Scharff, L. F. V., Hill, A., and Ahumada, A. J. (2000).Discriminability measures for predicting readability of text ontextured backgrounds, Optics Express 6(4), 81-90.
Whittle, P. (1986). Increments and decrements: luminancediscrimination, Vision Research 26, 1677-1691.
Whittle, P. (1992). Brightness, discriminability, and the„crispening effect‰, Vision Research 32,1493-1507.